介绍
本文将介绍在开发或使用 TT-Buda 和 TT-Metal 时可用的性能分析工具 – profiler 与 benchmark 工具。它们能帮助用户了解软件在硬件上的运行状态,以便进行软件分析和优化。
Profiler
Tenstorrent 的 Profiler 分为两个部分:host 端和 device 端。Host 端使用了开源软件 Tracy,主要用于分析 C++ 和 Python 程序,在此不作详细介绍,感兴趣的读者可自行了解开源项目 Tracy。本文将重点介绍 Device 端部分,包括使用方法和实现原理。
使用方法
使用之前,请确保在编译 TT-Metal 时使用 Profiler 参数。以下是编译和运行的示例命令:
cd $TT_METAL_HOME
scripts/build_scripts/build_with_profiler_opt.sh # 使用 profiler 编译脚本
make programming_examples # 编译测试用例
TT_METAL_DEVICE_PROFILER=1 ./build/programming_examples/profiler/test_full_buffer # 运行测试用例
执行时需要添加参数 TT_METAL_DEVICE_PROFILER,以启用 Profiler 的功能。
Device 端 Profiler 的使用相对简单,分为两步:首先在 Device kernel 的目标位置添加探测器,然后在 Host 端导出数据即可。
如下所示,添加探测器的方法是添加一行 DeviceZoneScopedN("l1_to_l1");,这里探测器与被观测的代码段要组成一个作用域,其原因将在后续的实现方法中提及。其中 l1_to_l1 是探测器的名字。
/// device 端 kernel0
+++    {
+++        DeviceZoneScopedN("l1_to_l1");
+++        noc_async_write(cb0_addr, noc_dst_addr, size);
+++        noc_async_write_barrier();
+++    }
---    noc_async_write(cb0_addr, noc_dst_addr, size);
---    noc_async_write_barrier();
/// device 端 kernel1
+++    {
+++        DeviceZoneScopedN("read_dram_to_l1");
+++        noc_async_read_tile(0, in_dram, cb0_addr);
+++        noc_async_read_barrier();
+++    }
---    noc_async_read_tile(0, in_dram, cb0_addr);
---    noc_async_read_barrier();
在 host 端调用函数 DumpDeviceProfileResults 导出结果:
 /// host端
 +++    tt::tt_metal::detail::DumpDeviceProfileResults(device);
        pass &= CloseDevice(device);
启用 Profiler 后,程序执行完成,会在当前目录生成文件 generated/profiler/.logs/profile_log_device.csv,该文件记录了 Profiler 收集的数据。
输出数据分析
将上述输出的 Profiler CSV 格式文件简化后,结果如下表所示:
| Property | Value | Value | Value | Value |
|---|---|---|---|---|
| PCIe slot | 0 | 0 | 0 | 0 |
| core_x | 1 | 1 | 1 | 1 |
| core_y | 1 | 1 | 1 | 1 |
| RISC processor type | BRISC | BRISC | NCRISC | NCRISC |
| timer_id | 6001 | 71537 | 65230 | 130766 |
| time[cycles since reset] | 16403633605079 | 16403633605422 | 16403633602836 | 16403633604827 |
| stat value | 0 | 0 | 0 | 0 |
| Run ID | 0 | 0 | 0 | 0 |
| zone name | l1_to_l1 | l1_to_l1 | read_dram_to_l1 | read_dram_to_l1 |
| zone phase | begin | end | begin | end |
| source line | 43 | 43 | 23 | 23 |
| source file | ./kernel.cpp | ./kernel.cpp | ./kernel.cpp | ./kernel.cpp |
Profiler 信息中的 Zone Name 就是探测器传入的字符串,每个 zone 分为 begin 和 end 两个 phase。除了源码位置、程序运行的 Tensix core 坐标以及具体在哪个 RISC-V 核上执行等这些细节之外,最重要的字段是 Time,用于表示定时器的周期(cycle)。Time 差值(End 与 Begin)即为探测器作用域内运行的总周期数。
有了运行时间信息后,就可以分析硬件性能并针对瓶颈进行软件优化。例如,从 L1(Tensix core 独享的 SRAM)传输到 L1 花费了(16403633602836 - 16403633605079 = 343)个周期,而从 DRAM(单张卡上所有 Tensix core 共享)传输到 L1 则花费了(16403633604827 - 16403633602836 = 1991) 个周期。因此,应尽可能减少对 DRAM 的使用,优先选择跨核数据传输,以提升性能。
使用硬件定时器做 Profiler 有以下注意事项:
-
单个 Tensix core 上的所有 RISC-V 核使用的是同一个定时器(Timer)。
-
不同 Tensix core 上的 Timer 存在微小的偏差,但基本上是同步的,因此可以用于比较不同 Tensix core 上的执行时间。然而,使用工具
tt-smi进行软重启会加剧 Timer 之间的偏差,从而使不同 Tensix core 上的比较失效,需要重启主机以恢复正常。 -
不同设备上的 Timer 不同步,因此不能用于不同设备之间的比较。
实现方法分析
Profiler 探测器的实现主要依赖宏 DeviceZoneScopedN ,展开如下所示:
#define DeviceZoneScopedN( name ) DO_PRAGMA(message(PROFILER_MSG_NAME(name))); \
auto constexpr hash = kernel_profiler::Hash16_CT(PROFILER_MSG_NAME(name)); \
kernel_profiler::profileScope<hash> zone = kernel_profiler::profileScope<hash>();
其中,构造了一个 profileScope 的实例,profileScope 的实现如下所示:
template<uint32_t timer_id>
struct profileScope
{
    bool start_marked = false;
    PROFILER_INLINE profileScope ()
    {
        if (wIndex < (PROFILER_L1_VECTOR_SIZE - stackSize))
        {
            stackSize += PROFILER_L1_MARKER_UINT32_SIZE;
            start_marked = true;
            mark_time_at_index_inlined(wIndex, timer_id);
            wIndex += PROFILER_L1_MARKER_UINT32_SIZE;
        }
    }
    PROFILER_INLINE ~profileScope ()
    {
        if (start_marked)
        {
            mark_time_at_index_inlined(wIndex, get_end_timer_id(timer_id));
            wIndex += PROFILER_L1_MARKER_UINT32_SIZE;
            start_marked = false;
            stackSize -= PROFILER_L1_MARKER_UINT32_SIZE;
        }
        if constexpr (dispatch)
        {
            if (wIndex >= (PROFILER_L1_VECTOR_SIZE - (QUICK_PUSH_MARKER_COUNT * PROFILER_L1_MARKER_UINT32_SIZE)))
            {
                quick_push();
            }
        }
    }
};
在 ProfileScope 的构造函数和析构函数中,都会调用 mark_time_at_index_inlined 函数。该函数实现如下所示,将硬件定时器的值 RISCV_DEBUG_REG_WALL_CLOCK_L 记录在缓冲区 profilerBuffer 中。在析构函数中,还会调用 quick_push 函数,将 profilerBuffer 中的数据传输到 DRAM 中,host 端将整理这些数据并输出到 CSV 文件。因为用到了类的构造和析构函数,所以需要将探测器和被观测的代码段放到同一个作用域内。
void mark_time_at_index_inlined(uint32_t index, uint32_t timer_id)
{
    volatile tt_l1_ptr uint32_t *buffer = reinterpret_cast<volatile tt_l1_ptr
        uint32_t*>(kernel_profiler::profilerBuffer);
    volatile tt_reg_ptr uint32_t *p_reg = reinterpret_cast<volatile tt_reg_ptr
        uint32_t *> (RISCV_DEBUG_REG_WALL_CLOCK_L);
    buffer[index] = 0x80000000 | ((timer_id & 0x7FFFF) << 12) | (p_reg[1] & 0xFFF);
    buffer[index+1] = p_reg[0];
}
Kernel Debug Print
TT-Metal 提供了内核打印机制,用于打印设备上运行的内核中的变量、地址和循环缓冲区数据,以便用户了解运行时状态。
使用方法
使用示例如下,用户只需使用宏 DPRINT 和 ENDL,其用法类似于 C++ stream,并支持了常见的几种类型。
void kernel_main() {
    // Direct printing is supported for const char*/char/uint32_t/float
    DPRINT << "Test string" << 'a' << 5 << 0.123456f << ENDL();
}
实现方法分析
#define DPRINT DebugPrinter()

template<typename T>
__attribute__((__noinline__))
DebugPrinter operator <<(DebugPrinter dp, T val) {
#if defined(DEBUG_PRINT_ENABLED) && !defined(PROFILE_KERNEL)
    DebugPrintData data{
        .sz = DebugPrintTypeToSize<T>(val), // includes terminating 0 for char*
        .data_ptr = DebugPrintTypeAddr<T>(&val),
        .type_id = DebugPrintTypeToId<T>()
    };
    debug_print(dp, data);
#endif // ENABLE_DEBUG_PRINT && !PROFILE_KERNEL
    return dp;
}
宏 DPRINT 展开如上所示,通过重载操作符 << 将数据放到 DebugPrintBuffer 中。然后,host 端会启用一个 dprint server 线程,监视 DebugPrintBuffer 是否有数据。如果数据可读,dprint server 会将数据从 DebugPrintBuffer 拷贝到 host 内存中并进行打印。
DebugPrintBuffer 和 profilerBuffer 的实现机制有点类似:它们都在核的独立地址空间中划分出一段单独的缓冲区,然后将要记录的信息(如时间和打印信息)保存在缓冲区内。最终,数据会从缓冲区拷贝到 host 端内存,并最终展示给用户。
benchmark
benchmark 是 Tenstorrent 官方 GitHub 提供的独立项目,用于对比不同模型在 GPU 和 Wormhole/Grayskull 下的性能。请注意,此项目的模型运行依赖于 TT-Buda 项目。
使用以下命令可以列出当前支持的模型:
$ python benchmark.py --list
Available models:

 -  bert                           configs:  ['tiny', 'base', 'large']
 -  deit                           configs:  ['base', 'small']
 -  falcon                         configs:  ['7b', '7b-instruct']
 -  flant5                         configs:  ['small', 'base', 'large']
 -  flant5_past_cache_enc_dec      configs:  ['small', 'base', 'large']
 -  hrnet                          configs:  ['w18', 'v2_w18', 'v2_w30', 'v2_w32', 'v2_w40', 'v2_w44', 'v2_w48', 'v2_w64']
 -  inception_v4                   configs:  ['224']
 -  mobilenetv1                    configs:  ['192', '224']
 -  mobilenetv2                    configs:  ['224', '160', '96']
 -  mobilenetv2_timm               configs:  ['1']
 -  mobilenetv3                    configs:  ['sm', 'lg']
 -  open_pose                      configs:  ['2d', '3d']
 -  resnet                         configs:  ['resnet18', 'resnet50']
 -  stable_diffusion               configs:  ['v1-4']
 -  t5                             configs:  ['small', 'base', 'large']
 -  t5_past_cache_enc_dec          configs:  ['small', 'base', 'large']
 -  unet                           configs:  ['256']
 -  vit                            configs:  ['base', 'large']
 -  vovnet_v1                      configs:  ['27s', '39', '57']
 -  vovnet_v2                      configs:  ['19', '39', '99']
 -  whisper                        configs:  ['tiny', 'base', 'small', 'medium', 'large']
 -  whisper_enc_dec                configs:  ['tiny', 'base', 'small', 'medium', 'large']
 -  yolo_v5                        configs:  ['s']
如上所示,支持的模型有 23 种。如果用户希望支持其他模型,需要在 benchmark 项目中使用 TT-Buda 的方式将这些模型重新实现。
使用方法
使用命令如下所示,通过调用脚本 benchmark.py 实现。Tenstorrent 设备和 GPU 使用 -d tt/cuda 参数进行区分。
// grayskull
python benchmark.py -d tt -m mobilenetv2 -c 224 --task image_classification -mb 64 \
   -mf HiFi3 --loop_count 8 --save_output
// cuda
python benchmark.py -d cuda -m mobilenetv2 -c 224 --task image_classification -df Fp16 \
   -mb 64 --loop_count 8 --save_output
输出数据分析
上述命令会在本地生成两个 JSON 文件。为了方便比较,将输出数据整理成表格,如下所示:
| Property | Grayskull | CUDA |
|---|---|---|
| total_run_time | 4.71147894859314 | 1.9360244274139404 |
| total_compilation_time | 66.82760572433472 | 0 |
| peak_host_mem_usage | 6173.569024 | 0 |
| total_samples | 7680 | 7680 |
| samples_per_sec | 1630.0614061521528 | 3966.892096634658 |
| tokens_per_sec | 0.0 | 0.0 |
| inference_time_ms | 0.6134738214313984 | 0.25208651398619014 |
| evaluation_score | 0.6875 | 0.7041666666666667 |
| input_size | 3x224x224 | 3x224x224 |
| device_name | Grayskull | NVIDIA GeForce RTX 3090 |
| machine_name | leo | tpt3090 |
| benchmark_date | Thu Mar 14 15:35:23 2024 | Thu Mar 14 15:39:03 2024 |
| host_device | Intel(R) Xeon(R) Gold 6133 CPU @ 2.50GHz | AMD Ryzen 9 3900X 12-Core Processor |
| pybuda_hash | 0.1.231222+dev.gs.f0eceb5 | |
| pybuda_version_date | N/A | |
| pytorch_version | 2.1.2+cu121 | |
| model | mobilenetv2 | mobilenetv2 |
| config | 224 | 224 |
| task | image_classification | image_classification |
| device | tt | cuda |
| training | false | false |
| dataformat | Fp16_b | Fp16 |
| math_fidelity | HiFi3 | HiFi3 |
| backend_opt_level | 3 | 3 |
| loop_count | 8 | 8 |
| microbatch | 64 | 64 |
| num_tokens | 1 | 1 |
| chips | 1 | 1 |
| recompute | false | false |
| trace | none | none |
| list | false | false |
| save_output | true | true |
| auto_transpose | false | false |
| dump_intermediate | null | null |
| dump_intermediate_tag | null | null |
| dump_intermediate_count | 1 | 1 |
| load_tti | null | null |
| save_tti | null | null |
| model_output | false | false |
从上述数据可以看出,在单张 Grayskull 卡上运行 MobileNetV2 模型比在 NVIDIA GeForce RTX 3090 上慢了两倍多。主要有三个原因:首先,单张 Grayskull 卡的性能不足;其次,Grayskull 的功耗只有 200 瓦,而 3090 的功耗约为 350 瓦;最后,TT-Buda 对 MobileNetV2 模型的优化不够。
下图是 MobileNetV2 模型的网表(Netlist)文件。整个模型被分为了8个 epoch,每个 epoch 包含了同一时间段加载运行的算子集合。在网表文件中,以 fwd_0_* 开头的项表示一个 epoch。每个 epoch 中的算子通过 grid_size 表示其占用的 Tensix core 数量,例如,第一个算子 matmul 占用了 4*1 个 Tensix core。将每个 epoch 中所有算子占用相加可以得到 Tensix core 的总利用情况。对于 MobileNetV2 模型,8 个 epoch 中 Tensix core 的占用情况是(51,62,102,61,51,42,64,29),单张卡一共有120个 Tensix core,平均利用率约为46%左右。理想情况下,核的利用率应该越高越好,而且,模型可以完全展开在一个 epoch 中,避免 epoch 切换时,需要从 DRAM 中将算子和数据重新加载,这样可以最大程度发挥硬件的性能。为了实现这一点,需要一个优秀的图编译器,能够有效地切分和映射计算图,更多图编译器相关信息请阅读前文 探索图编译器:实现高效的图计算。
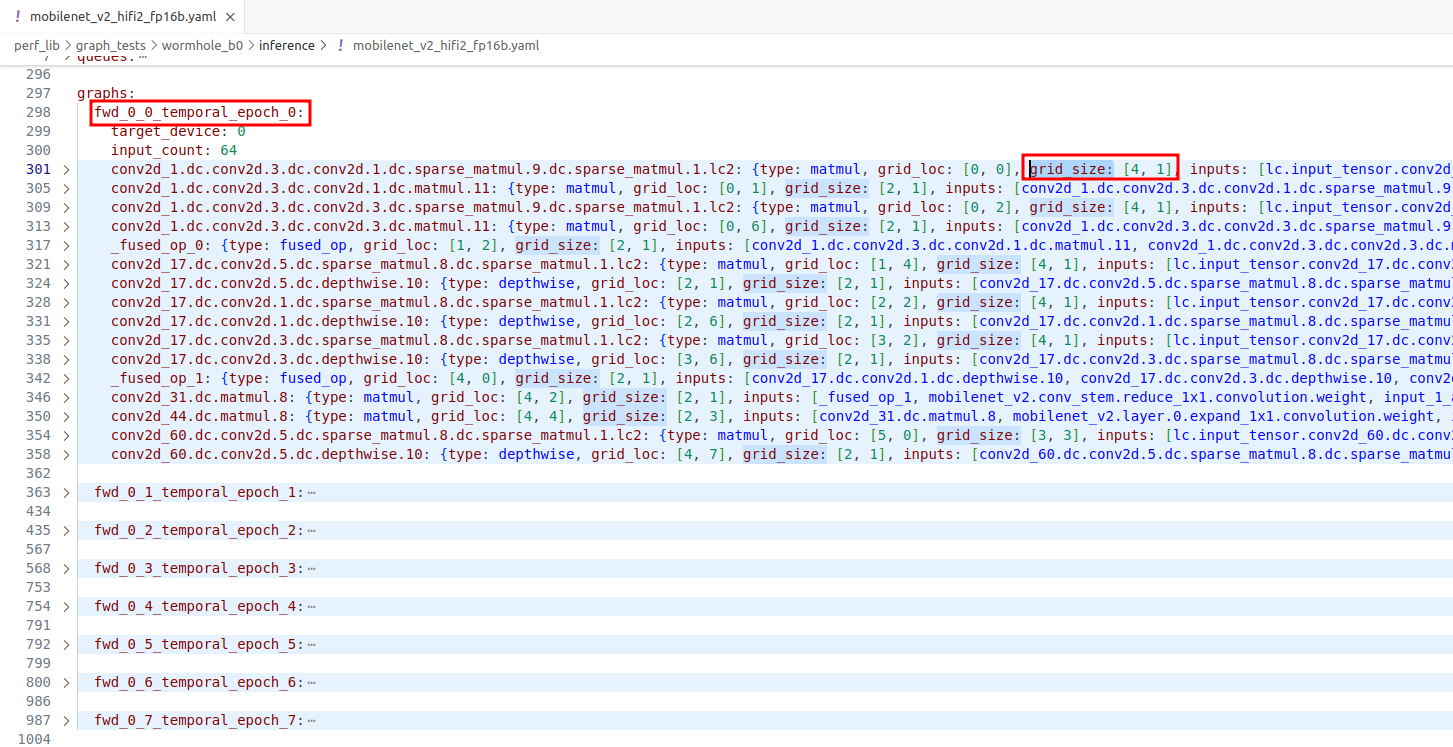
MobileNetV2 模型的网表(Netlist)文件
总结
本文介绍了 Tenstorrent 的几种工具,旨在帮助读者了解,如何在开发过程中对软硬件进行分析和优化。如需更多信息,请参阅官方文档。
参考资料
-
TT-Metal 官方文档 Welcome to TT-Metalium documentation! — TT-Metalium documentation
-
TT-NN 官方文档 Welcome to TT-NN documentation! — TT-NN documentation
-
TT-Metal API 接口 APIs — TT-Metalium documentation
-
TT-Metal github 仓库 GitHub - tenstorrent/tt-metal: 🤘 TT-NN operator library, and TT-Metalium low level kernel programming model.
-
TT-Buda 官方文档 Index | Tenstorrent
-
Benchmark 官方仓库 GitHub - tenstorrent/benchmarking: Repository for AI model benchmarking.